Quickstart
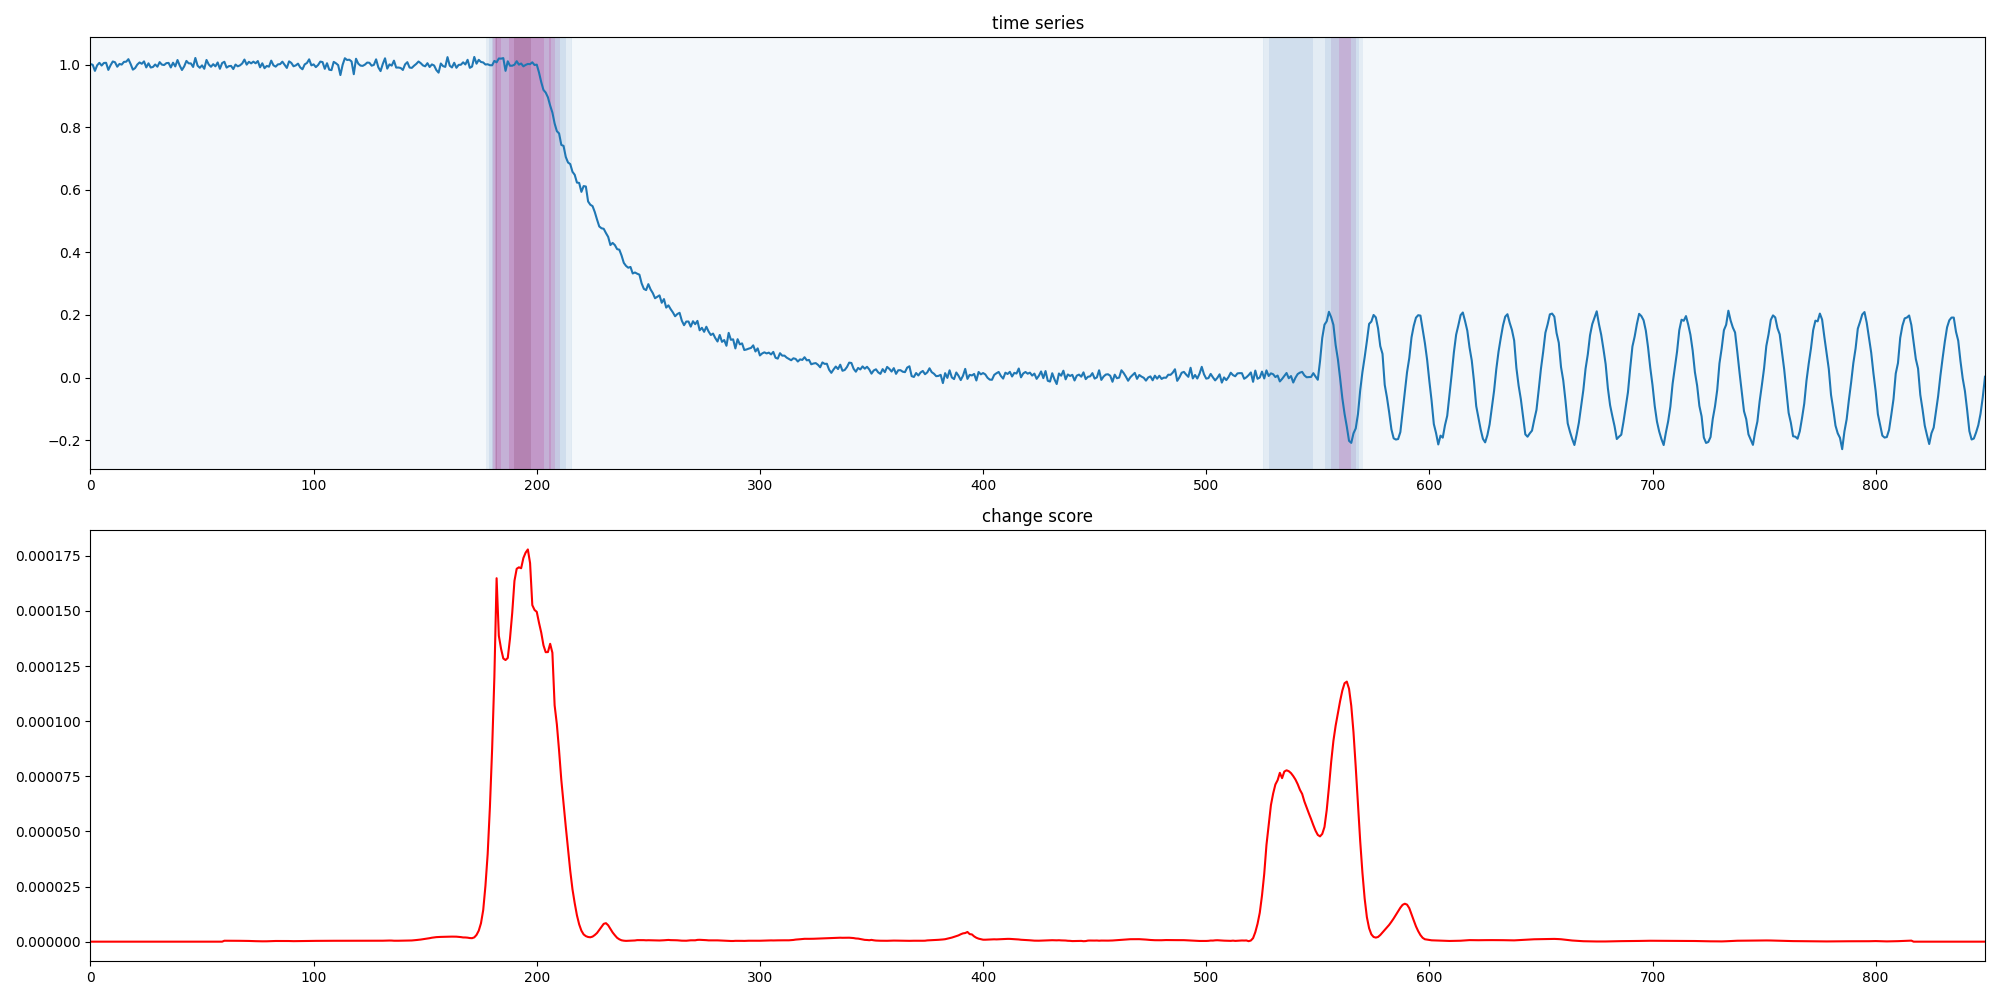
The following example creates a synthetic time series, computes change point scores with ESST and SST, and plots the results.
import numpy as np
import matplotlib.pyplot as plt

from changepoynt.algorithms.esst import ESST
from changepoynt.algorithms.sst import SST
from changepoynt.visualization.score_plotting import plot_data_and_score

# Create a signal that goes from steady to exponential decline into a sine curve.
exp_signal = np.exp(-np.linspace(0, 5, 200))
steady_after = np.exp(-5) * np.ones(150)
steady_before = np.ones(200)
sine_after = 0.2 * np.sin(np.linspace(0, 30 * np.pi, 300))

signal = np.concatenate((steady_before, exp_signal, steady_after, sine_after))
signal += 0.01 * np.random.randn(signal.shape[0])

esst_detector = ESST(40)
esst_detection = esst_detector.transform(signal)

sst_detector = SST(40, method="rsvd", mitigate_offset=True)
sst_detection = sst_detector.transform(signal)

plot_data_and_score(signal, esst_detection)
plt.gcf().tight_layout()

plot_data_and_score(signal, sst_detection)
plt.gcf().tight_layout()

plt.show()
The result should look similar to these examples:
ESST
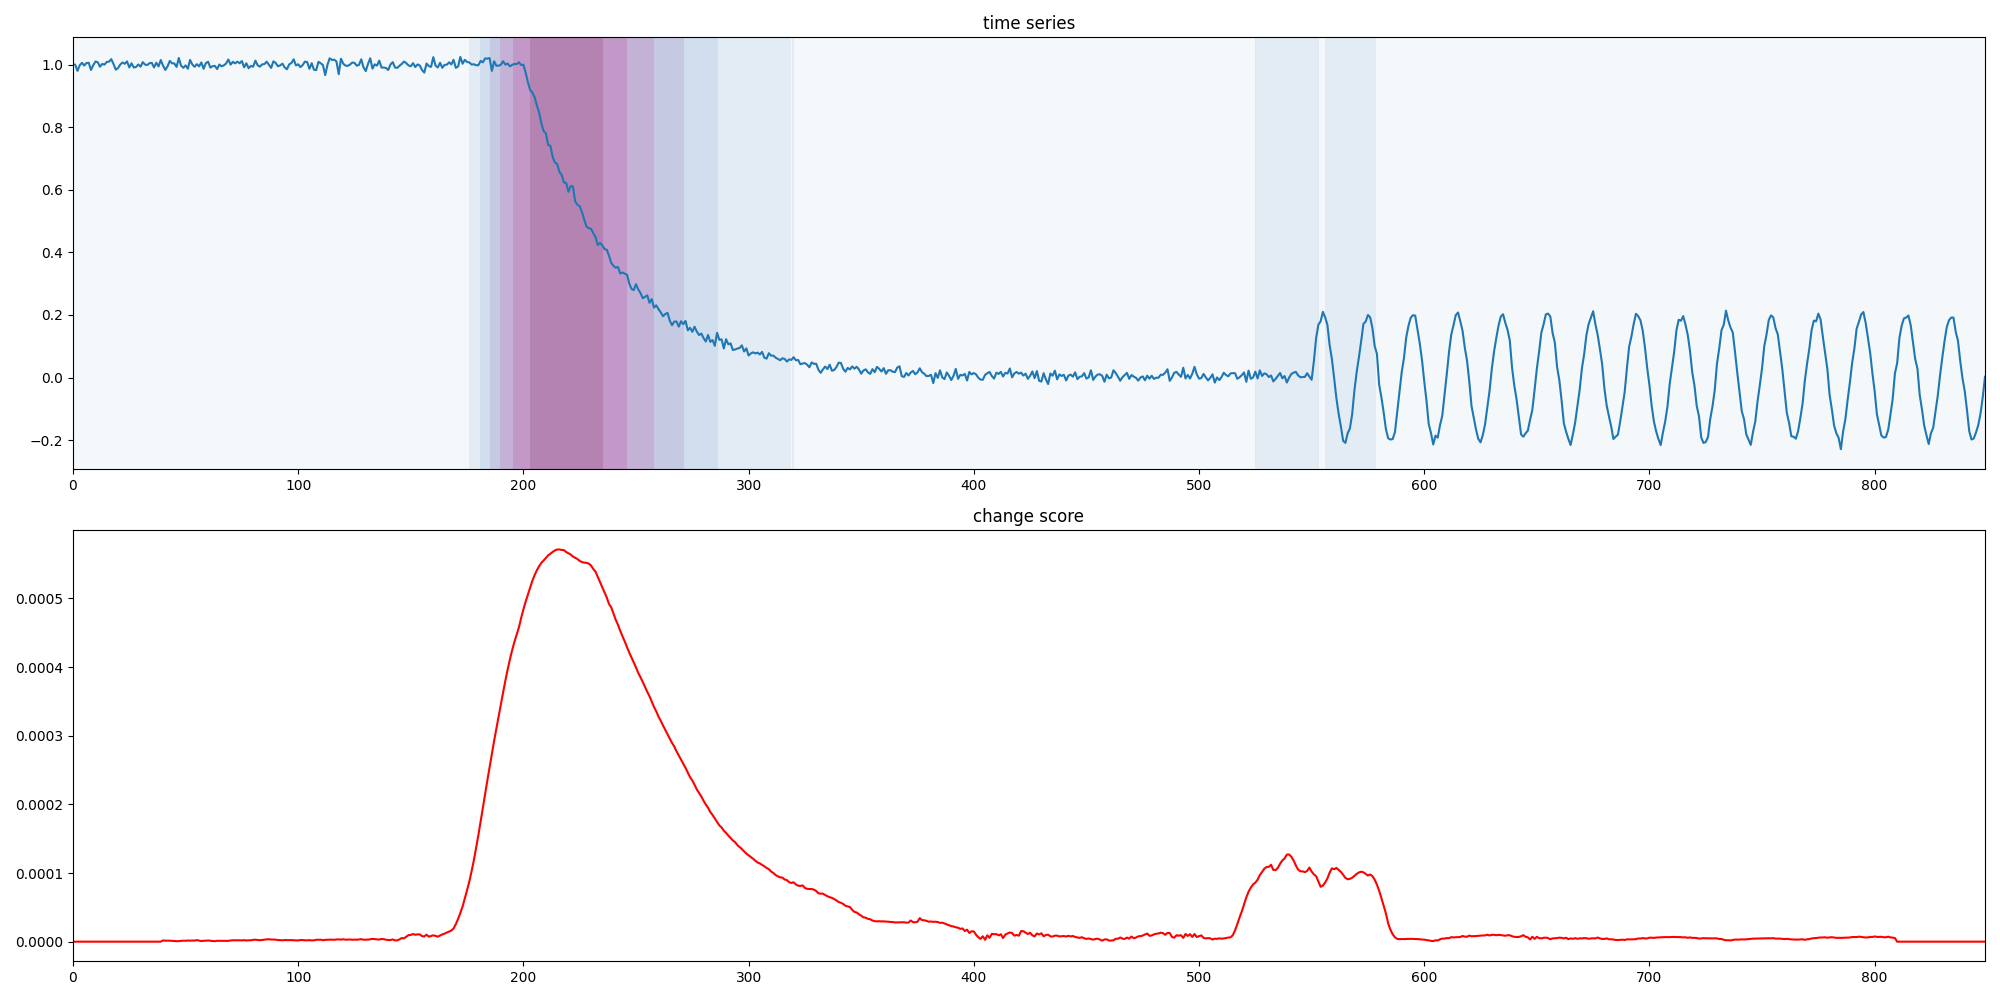
SST